
Page 104 - 2016能源統計手冊
P. 104
ࡈйঐ๕xVARIOUS FORMS OF ENERGY
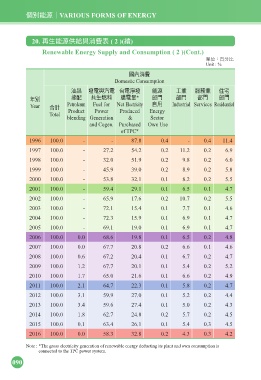
20. Ύ͛ঐ๕Զഗၾऊ൬ڌ ( 2 )(ᚃ)
Renewable Energy Supply and Consumption ( 2 )(Cont.)
ఊЗjϵʱˢ
Unit : %
ʫऊ൬
Domestic Consumption
ذۜ ೯ཥၾӛཥ ̨ཥଋ೯ ঐ๕ ʈุ ਕุ Иσ
ϋй ৣ ͛ዷࣘ ᒅཥඎ* ژ ژ ژ ژ
Year Υࠇ Petroleum Fuel for Net Electricity І͜ Industrial Services Residential
Total Product Power Produced Energy
blending Generation & Sector
and Cogen. Purchased Own Use
of TPC*
1996 100.0 - - 87.8 0.4 - 0.4 11.4
1997 100.0 - 27.2 54.2 0.2 11.2 0.2 6.9
1998 100.0 - 32.0 51.9 0.2 9.8 0.2 6.0
1999 100.0 - 45.9 39.0 0.2 8.9 0.2 5.8
2000 100.0 - 53.8 32.1 0.1 8.2 0.2 5.5
2001 100.0 - 59.4 29.1 0.1 6.5 0.1 4.7
2002 100.0 - 65.9 17.6 0.2 10.7 0.2 5.5
2003 100.0 - 72.1 15.4 0.1 7.7 0.1 4.6
2004 100.0 - 72.3 15.9 0.1 6.9 0.1 4.7
2005 100.0 - 69.1 19.0 0.1 6.9 0.1 4.7
2006 100.0 0.0 68.6 19.8 0.1 6.5 0.2 4.8
2007 100.0 0.0 67.7 20.8 0.2 6.6 0.1 4.6
2008 100.0 0.6 67.2 20.4 0.1 6.7 0.2 4.7
2009 100.0 1.2 67.7 20.1 0.1 5.4 0.2 5.2
2010 100.0 1.7 65.0 21.6 0.1 6.6 0.2 4.9
2011 100.0 2.1 64.7 22.3 0.1 5.8 0.2 4.7
2012 100.0 3.1 59.9 27.0 0.1 5.2 0.2 4.4
2013 100.0 3.4 59.6 27.4 0.1 5.0 0.2 4.3
2014 100.0 1.8 62.7 24.8 0.2 5.7 0.2 4.5
2015 100.0 0.1 63.4 26.1 0.1 5.4 0.3 4.5
2016 100.0 0.0 58.3 32.8 0.2 4.3 0.3 4.2
Note : *The gross electricity generation of renewable energy deducting its plant and own consumption is
connected to the TPC power system.
090