
Page 150 - 2016能源統計手冊
P. 150
ڝxANNEX
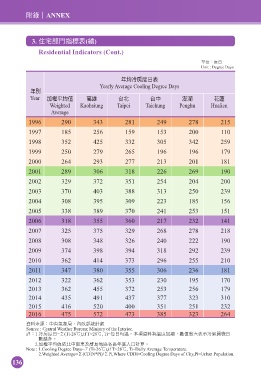
3. Иσژܸᅺڌ(ᚃ)
Residential Indicators (Cont.)
ఊЗjܓ˚
Unit : Degree Days
ϋѩиגܓ˚ڌ
Yearly Average Cooling Degree Days
ϋй
Year ̋ᛆ̻ѩ࠽ ৷ඪ ̨̏ ̨ʕ ᆔಳ ڀᇳ
Weighted Kaohsiung Taipei Taichung Penghu Hualien
Average
1996 290 343 281 249 278 215
1997 185 256 159 153 200 110
1998 352 425 332 305 342 259
1999 250 279 265 196 196 179
2000 264 293 277 213 201 181
2001 289 306 318 226 269 190
2002 329 372 351 254 204 200
2003 370 403 388 313 250 239
2004 308 395 309 223 185 156
2005 338 389 370 241 253 151
2006 318 355 360 217 232 141
2007 325 375 329 268 278 218
2008 308 348 326 240 222 190
2009 374 398 394 318 292 239
2010 362 414 373 296 255 210
2011 347 380 355 306 236 181
2012 322 362 353 230 195 170
2013 362 455 372 253 256 179
2014 435 491 437 377 323 310
2015 416 520 400 351 251 232
2016 475 572 473 385 323 264
༟ࣘԸ๕jʕ̯ं҅eʫ݁୕ࠇஈ
Source : Central Weather Bureau; Ministry of the Interior.
ൗj1.иגܓ˚=Ʋ(Ti-26Ċ),if T>28Ċ, Ti=ӊ˚ѩf͉ධ༟ࣘމܓ̋ᐼdᅰ࠽ฏɽڌͪиंකዚ˚
ᅰ൳εf
2.̋ᛆ̻ѩ࠽Ա̏ʕی؇ʿᕎࢥήਜਜϋֵɛɹࠇၑf
Note : 1.Cooling Degree Days=Ʋ(Ti-26Ċ),if T>28Ċ, Ti=Daily Average Temperature.
2.Weighted Average=Ʋ(CDDi*Pi)/ƲPi,Where CDDi=Cooling Degree Days of City,Pi=Urban Population.
136