
Page 146 - 2016能源統計手冊
P. 146
ڝxANNEX
2. ༶፩ژܸᅺڌ(ᚃ)
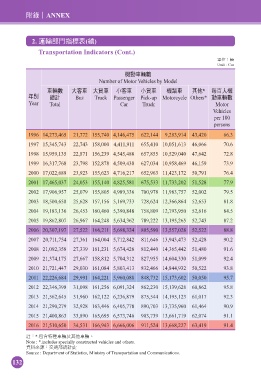
Transportation Indicators (Cont.)
ఊЗjሿ
Unit : Car
ዚਗԓሿᅰ
Number of Motor Vehicles by Model
ԓሿᅰ ɽ܄ԓ ɽԓ ʃ܄ԓ ʃԓ ዚሸԓ Չ˼* ӊϵɛዚ
ϋй ᐼࠇ Bus Truck Passenger Pick-up Motorcycle Others* ਗԓሿᅰ
Year Total Car Truck Motor
Vehicles
per 100
persons
1996 14,273,465 21,772 155,740 4,146,475 622,144 9,283,914 43,420 66.3
1997 15,345,743 22,743 158,000 4,411,911 655,410 10,051,613 46,066 70.6
1998 15,959,135 22,871 156,239 4,545,488 657,855 10,529,040 47,642 72.8
1999 16,317,768 23,798 152,878 4,509,430 627,034 10,958,469 46,159 73.9
2000 17,022,689 23,923 155,623 4,716,217 652,963 11,423,172 50,791 76.4
2001 17,465,037 24,053 155,140 4,825,581 675,533 11,733,202 51,528 77.9
2002 17,906,957 25,079 155,805 4,989,336 700,978 11,983,757 52,002 79.5
2003 18,500,658 25,628 157,156 5,169,733 728,624 12,366,864 52,653 81.8
2004 19,183,136 26,453 160,460 5,390,848 758,809 12,793,950 52,616 84.5
2005 19,862,807 26,967 164,248 5,634,362 789,222 13,195,265 52,743 87.2
2006 20,307,197 27,522 166,211 5,698,324 805,590 13,557,028 52,522 88.8
2007 20,711,754 27,361 164,004 5,712,842 811,646 13,943,473 52,428 90.2
2008 21,092,358 27,339 161,231 5,674,426 812,440 14,365,442 51,480 91.6
2009 21,374,175 27,667 158,812 5,704,312 827,955 14,604,330 51,099 92.4
2010 21,721,447 29,030 161,084 5,803,413 832,466 14,844,932 50,522 93.8
2011 22,226,684 29,991 164,221 5,960,088 848,732 15,173,602 50,050 95.7
2012 22,346,398 31,098 161,256 6,091,324 862,230 15,139,628 60,862 95.8
2013 21,562,645 31,960 162,122 6,236,879 875,544 14,195,123 61,017 92.3
2014 21,290,279 32,928 163,446 6,405,778 890,703 13,735,960 61,464 90.9
2015 21,400,863 33,890 165,695 6,573,746 903,739 13,661,719 62,074 91.1
2016 21,510,650 34,531 166,943 6,666,006 911,524 13,668,227 63,419 91.4
ൗj*.̍ўत၇ԓሿʿՉ˼ԓሿf
Note : *.includes specially constructed vehicles and others.
༟ࣘԸ๕jʹஷ୕ࠇஈ
Source : Department of Statistics, Ministry of Transportation and Communications.
132