
Page 142 - 2016能源統計手冊
P. 142
ڝxANNEX
1. ࠠࠅܸᅺڌ(ᚃ)
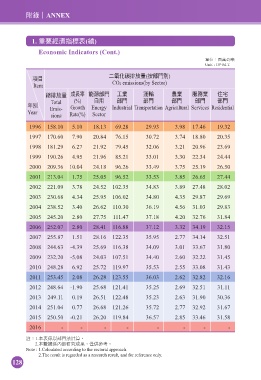
Economic Indicators (Cont.)
ఊЗjϵຬʮኚ
Unit : 10 6 M.T.
ɚःʷ၁ર׳ඎ(ܲژй)
ධͦ
Item CO2 emissions(by Sector)
ᐼર׳ඎ ϓڗଟ ঐ๕ژ ʈุ ༶፩ ุ༵ ਕุ Иσ
Total (%) І͜ ژ ژ ژ ژ ژ
ϋй Emis- Growth Energy Industrial Transportation Agricultural Services Residential
Year
sions Rate(%) Sector
1996 158.10 5.10 18.13 69.28 29.93 3.98 17.46 19.32
1997 170.60 7.90 20.84 76.15 30.72 3.74 18.80 20.35
1998 181.29 6.27 21.92 79.45 32.06 3.21 20.96 23.69
1999 190.26 4.95 21.96 85.21 33.01 3.30 22.34 24.44
2000 209.36 10.04 24.18 96.26 33.49 3.75 25.19 26.50
2001 213.04 1.75 25.05 96.52 33.53 3.85 26.65 27.44
2002 221.09 3.78 24.52 102.35 34.83 3.89 27.48 28.02
2003 230.68 4.34 25.95 106.02 34.80 4.35 29.87 29.69
2004 238.52 3.40 26.62 110.30 36.19 4.56 31.03 29.83
2005 245.20 2.80 27.75 111.47 37.18 4.20 32.76 31.84
2006 252.07 2.80 28.41 116.88 37.12 3.32 34.19 32.15
2007 255.87 1.51 28.16 122.35 35.95 2.77 34.14 32.51
2008 244.63 -4.39 25.69 116.38 34.09 3.01 33.67 31.80
2009 232.20 -5.08 24.03 107.51 34.40 2.60 32.22 31.45
2010 248.28 6.92 25.72 119.97 35.53 2.55 33.08 31.43
2011 253.45 2.08 26.28 123.55 36.03 2.62 32.82 32.16
2012 248.64 -1.90 25.68 121.41 35.25 2.69 32.51 31.11
2013 249.11 0.19 26.51 122.48 35.23 2.63 31.90 30.36
2014 251.04 0.77 26.68 121.26 35.72 2.77 32.92 31.67
2015 250.50 -0.21 26.20 119.84 36.57 2.85 33.46 31.58
2016 - - - - - - - -
ൗj1.͉ڌڷ˸ژجࠇၑf
2.͉ᅰኽڷʫӺϓ؈dසԶਞϽf
Note : 1.Calculated according to the sectoral approach.
2.The result is regarded as a research result, and for reference only.
128