
Page 137 - 2016能源統計手冊
P. 137
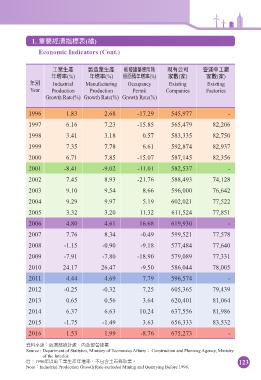
1. ࠠࠅܸᅺڌ(ᚃ)
Economic Indicators (Cont.)
ʈุ͛ପ Ⴁிุ͛ପ ࣨ೯ܔጘԴ͜ੂ ତϞʮ̡ ᐄ༶ʕʈᅀ
ϋᄣଟ(%) ϋᄣଟ(%) ࠦጐϋᄣଟ(%) ᅰ() ᅰ()
ϋй Industrial Manufacturing Occupancy Existing Existing
Year Production Production Permit Companies Factories
Growth Rate(%) Growth Rate(%) Growth Rate(%)
1996 1.83 2.68 -17.29 545,977 -
1997 6.16 7.23 -15.85 565,479 82,206
1998 3.41 3.18 0.57 583,335 82,750
1999 7.35 7.78 6.61 592,874 82,937
2000 6.71 7.85 -15.07 587,145 82,356
2001 -8.41 -9.02 -11.01 582,537 -
2002 7.45 8.93 -21.76 588,493 74,128
2003 9.10 9.54 8.66 596,000 76,642
2004 9.29 9.97 5.19 602,021 77,522
2005 3.32 3.20 11.32 611,524 77,851
2006 4.80 4.61 16.68 619,930 -
2007 7.76 8.34 -0.49 599,521 77,578
2008 -1.15 -0.90 -9.18 577,484 77,640
2009 -7.91 -7.80 -18.90 579,089 77,331
2010 24.17 26.47 -9.50 586,044 78,005
2011 4.44 4.69 7.79 596,574 -
2012 -0.25 -0.32 7.25 605,365 79,439
2013 0.65 0.56 3.64 620,401 81,064
2014 6.37 6.63 10.24 637,556 81,986
2015 -1.75 -1.49 3.63 656,333 83,532
2016 1.53 1.99 -8.76 675,273 -
༟ࣘԸ๕j୕ࠇஈeʫ݁ᐄܔ
Source : Department of Statistics, Ministry of Economics Affairsi Construction and Planning Agency, Ministry
of the Interior.
ൗj1996ϋ˸ۃʈุ͛ପϋᄣଟdʔ̍ўɺͩમ՟ุf 123
NotejIndustrial Production Growth Rate excluded Mining and Quarrying Before 1996.