
Page 141 - 2016能源統計手冊
P. 141
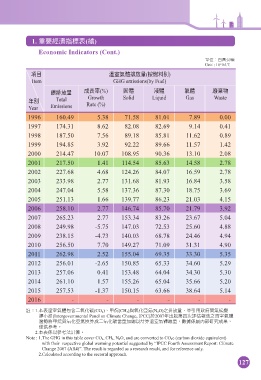
1. ࠠࠅܸᅺڌ(ᚃ)
Economic Indicators (Cont.)
ఊЗjϵຬʮኚ
Unit : 10 6 M.T.
ධͦ ܃ंર׳ඎ(ܲዷࣘй)
Item GHG emissions(by Fuel)
ᐼર׳ඎ ϓڗଟ(%) ո ૰ ं ᄻي
Growth
ϋй Total Rate (%) Solid Liquid Gas Waste
Year Emissions
1996 160.49 5.38 71.58 81.01 7.89 0.00
1997 174.31 8.62 82.08 82.69 9.14 0.41
1998 187.50 7.56 89.18 85.81 11.62 0.89
1999 194.85 3.92 92.22 89.66 11.57 1.42
2000 214.47 10.07 108.95 90.36 13.10 2.08
2001 217.50 1.41 114.54 85.63 14.58 2.78
2002 227.68 4.68 124.26 84.07 16.59 2.78
2003 233.98 2.77 131.68 81.93 16.84 3.58
2004 247.04 5.58 137.36 87.30 18.75 3.69
2005 251.13 1.66 139.77 86.23 21.03 4.15
2006 258.10 2.77 146.74 85.70 21.79 3.92
2007 265.23 2.77 153.34 83.26 23.67 5.04
2008 249.98 -5.75 147.03 72.53 25.60 4.88
2009 238.15 -4.73 140.03 68.78 24.46 4.94
2010 256.50 7.70 149.27 71.09 31.31 4.90
2011 262.98 2.52 155.04 69.35 33.30 5.35
2012 256.01 -2.65 150.85 65.33 34.60 5.29
2013 257.06 0.41 153.48 64.04 34.30 5.30
2014 261.10 1.57 155.26 65.04 35.66 5.20
2015 257.53 -1.37 150.15 63.66 38.64 5.14
2016 - - - - - -
ൗj1.͉ڌ܃ं̍ўɚःʷ၁(CO 2 )e͠Ὦ(CH 4 )ၾःʷԭಢ(N 2 O)ʘર׳ඎdԨˏִ݁͜ගंࡉᜊ
ቋʃଡ଼(Intergovernmental Panel on Climate Change, IPCC)2007ϋ̈وୋ̬ϣ൙Пజѓʘ܃ं
ᆑැਗ਼͠Ὦၾःʷԭಢ౬ၑϓɚःʷ၁ඎ̋ᐼ˸ࠇၑ܃ंᐼඎdᅰኽڷ᙮ʫӺϓ؈d
සԶਞϽf
2.͉ڌڷ˸ਞϽجࠇၑf
Note : 1.The GHG in this table cover CO 2 , CH 4 , N 2 O, and are converted to CO 2 e (carbon dioxide equivalent)
with their respective global warming potential suggested by “IPCC Fourth Assessment Report: Climate
Change 2007 (AR4)”. The result is regarded as a research result, and for reference only.
2.Calculated according to the sectoral approach.
127