
Page 138 - 2016能源統計手冊
P. 138
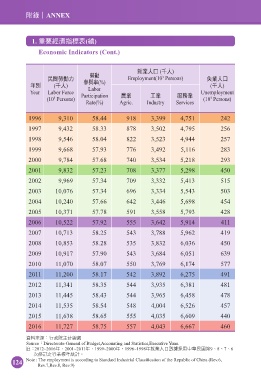
ڝxANNEX
1. ࠠࠅܸᅺڌ(ᚃ)
Economic Indicators (Cont.)
ఱุɛɹ (ɷɛ)
௶ਗ
3
͏ග௶ਗɢ Employment(10 Persons) ุ̰ɛɹ
ϋй (ɷɛ) ਞၾଟ(%) (ɷɛ)
Labor
Year Labor Force Participation ุ༵ ʈุ ਕุ Unemployment
(10 Persons) (10 Persons)
3
3
Rate(%) Agric. Industry Services
1996 9,310 58.44 918 3,399 4,751 242
1997 9,432 58.33 878 3,502 4,795 256
1998 9,546 58.04 822 3,523 4,944 257
1999 9,668 57.93 776 3,492 5,116 283
2000 9,784 57.68 740 3,534 5,218 293
2001 9,832 57.23 708 3,377 5,298 450
2002 9,969 57.34 709 3,332 5,413 515
2003 10,076 57.34 696 3,334 5,543 503
2004 10,240 57.66 642 3,446 5,698 454
2005 10,371 57.78 591 3,558 5,793 428
2006 10,522 57.92 555 3,642 5,914 411
2007 10,713 58.25 543 3,788 5,962 419
2008 10,853 58.28 535 3,832 6,036 450
2009 10,917 57.90 543 3,684 6,051 639
2010 11,070 58.07 550 3,769 6,174 577
2011 11,200 58.17 542 3,892 6,275 491
2012 11,341 58.35 544 3,935 6,381 481
2013 11,445 58.43 544 3,965 6,458 478
2014 11,535 58.54 548 4,004 6,526 457
2015 11,638 58.65 555 4,035 6,609 440
2016 11,727 58.75 557 4,043 6,667 460
༟ࣘԸ๕jБ݁৫˴ࠇᐼஈ
SourcejDirectorate-General of Budget,Accounting and Statistics,Executive Yuan.
ൗj2012~2016ϋe2001~2011ϋe1999~2000ϋe1996~1998ϋఱุɛɹᅰኽમ͜ʕശ͏ୋ9e8e7e6
ϣࡌࠈʘБุᅺ୕ࠇf
124 Note : The employment is according to Standard Industrial Classification of the Republic of China (Rev.6,
Rev.7,Rev.8, Rev.9)