
Page 135 - 2016能源統計手冊
P. 135
1. ࠠࠅܸᅺڌ(ᚃ)
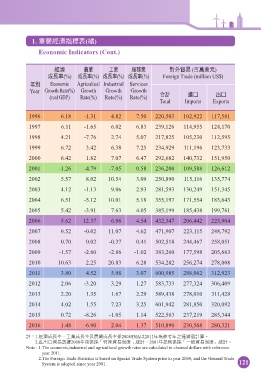
Economic Indicators (Cont.)
ุ༵ ʈุ ਕุ ࿁̮൱ (ϵຬߕʩ)
ϓڗଟ(%) ϓڗଟ(%) ϓڗଟ(%) ϓڗଟ(%) Foreign Trade (million US$)
ϋй Economic Agricultual Industrial Services
Year Growth Rate(%) Growth Growth Growth
(real GDP) Rate(%) Rate(%) Rate(%) Υࠇ ආɹ ̈ɹ
Total Imports Exports
1996 6.18 -1.31 4.82 7.50 220,503 102,922 117,581
1997 6.11 -1.65 6.02 6.83 239,126 114,955 124,170
1998 4.21 -7.76 2.74 5.07 217,825 105,230 112,595
1999 6.72 3.42 6.38 7.25 234,929 111,196 123,733
2000 6.42 1.82 7.07 6.47 292,682 140,732 151,950
2001 -1.26 -4.79 -7.05 0.58 236,200 109,588 126,612
2002 5.57 8.02 10.54 3.09 250,890 115,116 135,774
2003 4.12 -1.13 9.06 2.93 281,593 130,249 151,345
2004 6.51 -5.12 10.01 5.18 355,197 171,554 183,643
2005 5.42 -3.91 7.63 4.05 385,199 185,438 199,761
2006 5.62 12.37 6.96 4.54 432,347 206,442 225,904
2007 6.52 -0.02 11.07 4.62 471,907 223,115 248,792
2008 0.70 0.02 -0.37 0.41 502,518 244,467 258,051
2009 -1.57 -2.60 -2.86 -1.02 383,260 177,598 205,663
2010 10.63 2.25 20.83 6.28 534,282 256,274 278,008
2011 3.80 4.52 5.98 3.07 600,985 288,062 312,923
2012 2.06 -3.20 3.29 1.27 583,733 277,324 306,409
2013 2.20 1.35 1.67 2.29 589,438 278,010 311,428
2014 4.02 1.55 7.23 3.25 601,942 281,850 320,092
2015 0.72 -8.26 -1.05 1.14 522,563 237,219 285,344
2016 1.48 -6.90 2.04 1.37 510,890 230,568 280,321
ൗj1.ϓڗଟeʈุϓڗଟʿุ༵ϓڗଟમ2008SNA˸2011ϋމਞϽϋʘஹᕁ࠽ࠇၑf
2.ආ̈ɹ൱ᅰኽ2000ϋۃڷમतࣿ൱Փܓ୕ࠇd2001ϋৎۆڷમɓছ൱Փܓ୕ࠇf
Note : 1.The economic,industrial and agricultural growth rates are calculated in chained dollars with reference
year 2011.
2.The Foreign Trade Statistics is based on Special Trade System prior to year 2000, and the General Trade
System is adopted since year 2001. 121