
Page 136 - 2016能源統計手冊
P. 136
ڝxANNEX
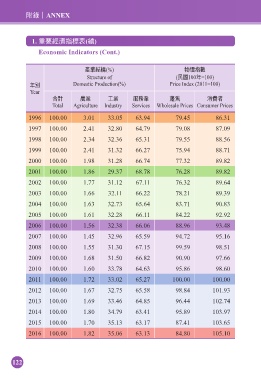
1. ࠠࠅܸᅺڌ(ᚃ)
Economic Indicators (Cont.)
ପุഐ(%) يᄆܸᅰ
Structure of (͏100ϋ=100)
ϋй Domestic Production(%) Price Index (2011=100)
Year
Υࠇ ุ༵ ʈุ ਕุ ᙌਯ ऊ൬٫
Total Agriculture Industry Services Wholesale Prices Consumer Prices
1996 100.00 3.01 33.05 63.94 79.45 86.31
1997 100.00 2.41 32.80 64.79 79.08 87.09
1998 100.00 2.34 32.36 65.31 79.55 88.56
1999 100.00 2.41 31.32 66.27 75.94 88.71
2000 100.00 1.98 31.28 66.74 77.32 89.82
2001 100.00 1.86 29.37 68.78 76.28 89.82
2002 100.00 1.77 31.12 67.11 76.32 89.64
2003 100.00 1.66 32.11 66.22 78.21 89.39
2004 100.00 1.63 32.73 65.64 83.71 90.83
2005 100.00 1.61 32.28 66.11 84.22 92.92
2006 100.00 1.56 32.38 66.06 88.96 93.48
2007 100.00 1.45 32.96 65.59 94.72 95.16
2008 100.00 1.55 31.30 67.15 99.59 98.51
2009 100.00 1.68 31.50 66.82 90.90 97.66
2010 100.00 1.60 33.78 64.63 95.86 98.60
2011 100.00 1.72 33.02 65.27 100.00 100.00
2012 100.00 1.67 32.75 65.58 98.84 101.93
2013 100.00 1.69 33.46 64.85 96.44 102.74
2014 100.00 1.80 34.79 63.41 95.89 103.97
2015 100.00 1.70 35.13 63.17 87.41 103.65
2016 100.00 1.82 35.06 63.13 84.80 105.10
122