
Page 140 - 2016能源統計手冊
P. 140
ڝxANNEX
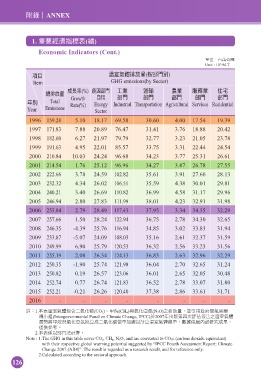
1. ࠠࠅܸᅺڌ(ᚃ)
Economic Indicators (Cont.)
ఊЗjϵຬʮኚ
Unit : 10 6 M.T.
ධͦ ܃ंર׳ඎ(ܲژй)
Item GHG emissions(by Sector)
ϓڗଟ(%) ঐ๕ژ ʈุ ༶፩ ุ༵ ਕุ Иσ
ᐼર׳ඎ І͜ ژ ژ ژ ژ ژ
Growth
ϋй Total Rate(%) Energy Industrial Transportation Agricultural Services Residential
Year Emissions Sector
1996 159.28 5.10 18.17 69.58 30.60 4.00 17.54 19.39
1997 171.83 7.88 20.89 76.47 31.41 3.76 18.88 20.42
1998 182.60 6.27 21.97 79.79 32.77 3.23 21.05 23.78
1999 191.63 4.95 22.01 85.57 33.75 3.31 22.44 24.54
2000 210.84 10.03 24.24 96.68 34.23 3.77 25.31 26.61
2001 214.54 1.76 25.12 96.96 34.27 3.87 26.78 27.55
2002 222.66 3.78 24.59 102.82 35.61 3.91 27.60 28.13
2003 232.32 4.34 26.02 106.51 35.59 4.38 30.01 29.81
2004 240.21 3.40 26.69 110.82 36.99 4.58 31.17 29.96
2005 246.94 2.80 27.83 111.99 38.01 4.23 32.91 31.98
2006 253.84 2.79 28.49 117.43 37.95 3.34 34.35 32.29
2007 257.66 1.50 28.24 122.94 36.75 2.78 34.30 32.65
2008 246.35 -4.39 25.76 116.94 34.85 3.02 33.83 31.94
2009 233.87 -5.07 24.09 108.03 35.16 2.61 32.37 31.59
2010 249.99 6.90 25.79 120.53 36.32 2.56 33.23 31.56
2011 255.19 2.08 26.34 124.13 36.83 2.63 32.96 32.29
2012 250.35 -1.90 25.74 121.98 36.04 2.70 32.65 31.24
2013 250.82 0.19 26.57 123.06 36.01 2.65 32.05 30.48
2014 252.74 0.77 26.74 121.83 36.52 2.78 33.07 31.80
2015 252.21 -0.21 26.26 120.40 37.38 2.86 33.61 31.71
2016 - - - - - - - -
ൗj1.͉ڌ܃ं̍ўɚःʷ၁(CO 2 )e͠Ὦ(CH 4 )ၾःʷԭಢ(N 2 O)ʘર׳ඎdԨˏִ݁͜ගंࡉᜊ
ቋʃଡ଼(Intergovernmental Panel on Climate Change, IPCC)2007ϋ̈وୋ̬ϣ൙Пజѓʘ܃ं
ᆑැਗ਼͠Ὦၾःʷԭಢ౬ၑϓɚःʷ၁ඎ̋ᐼ˸ࠇၑ܃ंᐼඎdᅰኽڷ᙮ʫӺϓ؈d
සԶਞϽf
2.͉ڌڷ˸ژجࠇၑf
Note : 1.The GHG in this table cover CO 2 , CH 4 , N 2 O, and are converted to CO 2 e (carbon dioxide equivalent)
with their respective global warming potential suggested by “IPCC Fourth Assessment Report: Climate
Change 2007 (AR4)”. The result is regarded as a research result, and for reference only.
2.Calculated according to the sectoral approach.
126