
Page 139 - 2016能源統計手冊
P. 139
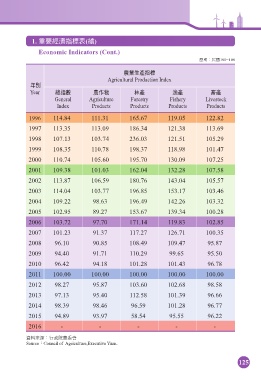
1. ࠠࠅܸᅺڌ(ᚃ)
Economic Indicators (Cont.)
ਿಂj͏100=100
ุ༵͛ପܸᅺ
Agricultural Production Index
ϋй
Year ᐼܸᅰ ༵Ъي ؍ପ ဝପ ळପ
General Agriculture Forestry Fishery Livestock
Index Products Products Products Products
1996 114.84 111.31 165.67 119.05 122.82
1997 113.35 113.09 186.34 121.38 113.69
1998 107.13 103.74 236.03 121.51 105.29
1999 108.35 110.78 198.37 118.98 101.47
2000 110.74 105.60 195.70 130.09 107.25
2001 109.38 101.03 162.04 132.28 107.58
2002 113.87 106.59 180.76 143.04 105.57
2003 114.04 103.77 196.85 153.17 103.46
2004 109.22 98.63 196.49 142.26 103.32
2005 102.95 89.27 153.67 139.34 100.28
2006 103.72 97.70 171.14 119.83 102.85
2007 101.23 91.37 117.27 126.71 100.35
2008 96.10 90.85 108.49 109.47 95.87
2009 94.40 91.71 110.29 99.65 95.50
2010 96.42 94.18 101.28 101.43 96.78
2011 100.00 100.00 100.00 100.00 100.00
2012 98.27 95.87 103.60 102.68 98.58
2013 97.13 95.40 112.58 101.39 96.66
2014 98.39 98.46 96.59 101.28 96.77
2015 94.89 93.97 58.54 95.55 96.22
2016 - - - - -
༟ࣘԸ๕jБ݁৫༵։ึ
SourcejCouncil of Agriculture,Executive Yuan.
125