
Page 23 - 2016能源統計手冊
P. 23
2. ঐ๕ࣖଟܸᅺ
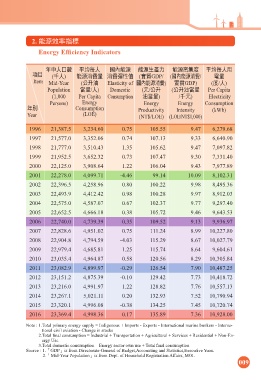
Energy Efficiency Indicators
ϋʕɛɹᅰ ̻ѩӊɛ ʫঐ๕ ঐ๕͛ପɢ ঐ๕ණܓ ̻ѩӊɛ͜
ධͦ (ɷɛ) ঐ๕ऊ൬ඎ ऊ൬ᅁ࠽ (ྼሯGDP/ (ʫঐ๕ऊ൬/ ཥඎ
Item Mid-Year (ʮʺذ Elasticity of ʫঐ๕ऊ൬) ྼሯGDP) (ܓ/ɛ)
Population ඎ/ɛ) Domestic (ʩ/ʮʺ (ʮʺذඎ Per Capita
(1,000 Per Capita Consumption ذඎ) /ɷʩ) Electricity
Persons) Energy Energy Energy Consumption
ϋй Consumption Productivity Intensity (kWh)
Year (LOE) (NT$/LOE) (LOE/NT$1,000)
1996 21,387.5 3,234.60 0.75 105.55 9.47 6,279.68
1997 21,577.0 3,352.06 0.74 107.13 9.33 6,640.90
1998 21,777.0 3,510.43 1.35 105.62 9.47 7,097.82
1999 21,952.5 3,652.32 0.73 107.47 9.30 7,331.40
2000 22,125.0 3,908.64 1.22 106.04 9.43 7,977.89
2001 22,278.0 4,099.71 -4.46 99.14 10.09 8,102.31
2002 22,396.5 4,258.96 0.80 100.22 9.98 8,495.36
2003 22,493.9 4,412.42 0.98 100.28 9.97 8,912.03
2004 22,575.0 4,587.07 0.67 102.37 9.77 9,297.40
2005 22,652.5 4,666.18 0.38 105.72 9.46 9,643.53
2006 22,740.0 4,739.39 0.35 109.52 9.13 9,936.97
2007 22,828.6 4,951.02 0.75 111.24 8.99 10,227.80
2008 22,904.8 4,794.59 -4.03 115.29 8.67 10,027.79
2009 22,979.4 4,685.81 1.25 115.74 8.64 9,604.61
2010 23,035.4 4,964.87 0.58 120.56 8.29 10,305.84
2011 23,082.9 4,899.97 -0.29 126.54 7.90 10,487.25
2012 23,151.2 4,875.39 -0.10 129.42 7.73 10,418.72
2013 23,216.0 4,991.97 1.22 128.82 7.76 10,557.13
2014 23,267.1 5,021.11 0.20 132.93 7.52 10,790.94
2015 23,320.1 4,996.08 -0.38 134.25 7.45 10,720.74
2016 23,369.4 4,998.36 0.17 135.89 7.36 10,928.00
Note : 1.Total primary energy supply = Indigenous + Imports - Exports - International marine bunkers - Interna-
tional civil aviation - Change in stocks
2.Total final consumption = Industrial + Transportation + Agricultural + Services + Residential + Non-En-
ergy Use
3.Total domestic consumption = Energy sector own use + Total final consumption
Source : 1.GDPis from Directorate-General of Budget,Accounting and Statistics,Executive Yuan.
2.Mid-Year Populationis from Dept. of Household Registration Affairs, MOI.
009