
Page 25 - 2016能源統計手冊
P. 25
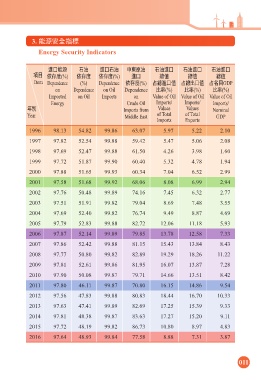
3. ঐ๕τΌܸᅺ
          Energy Security Indicators

             ආɹঐ๕   ͩذ   ආɹͩذ   ʕ؇ࡡذ  ͩذආɹ   ͩذආɹ   ͩذආɹ
         ධͦ Աπܓ(%)  Աπܓ  Աπܓ(%)  ආɹ    ᐼ࠽     ᐼ࠽     ᐼ࠽
         Item Dependence  (%)  Dependence  Աπܓ(%) ̕ᐼආɹ࠽  ̕ᐼ̈ɹ࠽ ̕ΤͦGDP
              on   Dependence  on Oil   Dependence    ˢଟ(%)  ˢଟ(%)  ˢଟ(%)
             Imported   on Oil  Imports  on   Value of Oil Value of Oil  Value of Oil
             Energy            Crude Oil   Imports/  Imports/  Imports/
        ϋй                     Imports from   Values   Values   Nominal
        Year                   Middle East  of Total   of Total   GDP
                                      Imports  Exports
        1996  98.13  54.82  99.86  63.07  5.97  5.22  2.10
        1997  97.82  52.54  99.88  59.42  5.47  5.06  2.08
        1998  97.69  52.47  99.88  61.50  4.26  3.98  1.60
        1999  97.72  51.87  99.90  60.40  5.32  4.78  1.94
        2000  97.88  51.65  99.93  60.34  7.04  6.52  2.99
        2001  97.58  51.68  99.92  68.06  8.08  6.99  2.94
        2002  97.76  50.48  99.89  74.16  7.45  6.32  2.77
        2003  97.51  51.91  99.82  79.04  8.69  7.48  3.55
        2004  97.69  52.40  99.82  76.74  9.49  8.87  4.69
        2005  97.79  52.83  99.88  82.72  12.06  11.18  5.93
        2006  97.87  52.14  99.89  79.85  13.78  12.58  7.33
        2007  97.86  52.42  99.88  81.15  15.43  13.84  8.43
        2008  97.77  50.80  99.82  82.89  19.29  18.26  11.22
        2009  97.81  52.61  99.86  81.95  16.07  13.87  7.28
        2010  97.90  50.08  99.87  79.71  14.66  13.51  8.42
        2011  97.80  46.11  99.87  70.80  16.15  14.86  9.54
        2012  97.56  47.83  99.88  80.83  18.44  16.70  10.33
        2013  97.63  47.41  99.89  82.69  17.25  15.39  9.33
        2014  97.81  48.38  99.87  83.63  17.27  15.20  9.11
        2015  97.72  48.19  99.82  86.73  10.80  8.97  4.83
        2016  97.64  48.93  99.84  77.58     8.88     7.31     3.87

                                                          011