
Page 59 - 2016能源統計手冊
P. 59
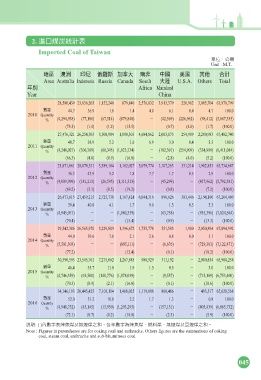
2. ආɹލ୕ࠇڌ
Imported Coal of Taiwan
ఊЗjʮኚ
Unit : M.T.
ήਜ ዦݲ Ι̵ ڶᖯ ̋ࣅɽ یڢ ʕ ߕ Չ˼ Υࠇ
Area Australia Indonesia Russia Canada South ɽ U.S.A. Others Total
ϋй Africa Mainland
Year China
28,580,439 23,636,203 1,152,240 879,840 2,576,032 3,913,379 226,962 3,005,704 63,970,799
ᅰඎ 44.7 36.9 1.8 1.4 4.0 6.1 0.4 4.7 100.0
2010 Quantity
% (4,294,938) (77,100) (67,514) (879,840) Ñ (42,569) (226,962) (98,412) (5,687,335)
(75.5) (1.4) (1.2) (15.5) Ñ (0.7) (4.0) (1.7) (100.0)
27,476,321 26,254,503 3,508,984 1,098,303 4,684,862 2,003,875 254,909 2,200,983 67,482,740
ᅰඎ 40.7 38.9 5.2 1.6 6.9 3.0 0.4 3.3 100.0
2011 Quantity
% (4,248,027) (306,769) (60,345) (1,023,734) Ñ (182,301) (254,909) (334,999) (6,411,084)
(66.3) (4.8) (0.9) (16.0) Ñ (2.8) (4.0) (5.2) (100.0)
23,871,861 28,870,511 3,389,184 1,182,027 5,079,774 1,107,263 331,214 1,902,853 65,734,687
ᅰඎ 36.3 43.9 5.2 1.8 7.7 1.7 0.5 2.9 100.0
2012 Quantity
% (4,009,999) (181,213) (26,595) (1,111,313) Ñ (45,299) Ñ (417,962) (5,792,381)
(69.2) (3.1) (0.5) (19.2) Ñ (0.8) Ñ (7.2) (100.0)
26,473,615 27,459,215 2,725,738 1,167,424 6,044,316 896,626 303,446 2,194,100 67,264,480
ᅰඎ 39.4 40.8 4.1 1.7 9.0 1.3 0.5 3.3 100.0
2013 Quantity
% (4,945,071) Ñ Ñ (1,080,339) Ñ (63,758) Ñ (935,396) (7,024,564)
(70.4) Ñ Ñ (15.4) Ñ (0.9) Ñ (13.3) (100.0)
29,542,386 26,565,970 5,229,809 1,396,672 1,755,778 551,583 1,900 2,050,894 67,094,992
ᅰඎ 44.0 39.6 7.8 2.1 2.6 0.8 0.0 3.1 100.0
2014 Quantity
% (5,501,303) Ñ Ñ (885,111) Ñ (6,676) Ñ (729,381) (7,122,471)
(77.2) Ñ Ñ (12.4) Ñ (0.1) Ñ (10.2) (100.0)
30,590,595 23,545,761 7,275,062 1,267,885 988,929 311,192 Ñ 2,000,834 65,980,258
ᅰඎ 46.4 35.7 11.0 1.9 1.5 0.5 Ñ 3.0 100.0
2015 Quantity
% (4,746,359) (63,500) (140,776) (1,078,039) Ñ (9,557) Ñ (715,169) (6,753,400)
(70.3) (0.9) (2.1) (16.0) Ñ (0.1) Ñ (10.6) (100.0)
34,146,193 20,445,425 7,103,114 1,460,025 1,119,888 860,406 Ñ 493,517 65,628,568
ᅰඎ 52.0 31.2 10.8 2.2 1.7 1.3 Ñ 0.8 100.0
2016 Quantity
% (4,948,752) (45,145) (15,950) (1,293,295) Ñ (157,151) Ñ (405,439) (6,865,732)
(72.1) (0.7) (0.2) (18.8) Ñ (2.3) Ñ (5.9) (100.0)
Ⴍ: ( )ʫᅰοڌೊʿೌʘձdϋᅰοމೊeዷࣘeೌʿԭʘձf
Note : Figures in parentheses are for coking coal and anthracite. Others figures are the summations of coking
coal, steam coal, anthracite and sub-bituminous coal.
045