
Page 82 - 2016能源統計手冊
P. 82
ࡈйঐ๕xVARIOUS FORMS OF ENERGY
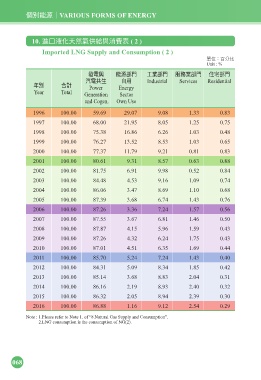
10. ආɹ૰ʷ˂್ंԶഗၾऊ൬ڌ ( 2 )
Imported LNG Supply and Consumption ( 2 )
ఊЗjϵʱˢ
Unit : %
೯ཥၾ ঐ๕ژ ʈุژ ਕุژ Иσژ
ӛཥ͛ І͜ Industrial Services Residential
ϋй Υࠇ Power Energy
Year Total Generation Sector
and Cogen. Own Use
1996 100.00 59.69 29.07 9.08 1.33 0.83
1997 100.00 68.00 21.95 8.05 1.25 0.75
1998 100.00 75.38 16.86 6.26 1.03 0.48
1999 100.00 76.27 13.52 8.53 1.03 0.65
2000 100.00 77.37 11.79 9.21 0.81 0.83
2001 100.00 80.61 9.31 8.57 0.63 0.88
2002 100.00 81.75 6.91 9.98 0.52 0.84
2003 100.00 84.48 4.53 9.16 1.09 0.74
2004 100.00 86.06 3.47 8.69 1.10 0.68
2005 100.00 87.39 3.68 6.74 1.43 0.76
2006 100.00 87.26 3.36 7.24 1.57 0.56
2007 100.00 87.55 3.67 6.81 1.46 0.50
2008 100.00 87.87 4.15 5.96 1.59 0.43
2009 100.00 87.26 4.32 6.24 1.75 0.43
2010 100.00 87.01 4.51 6.35 1.69 0.44
2011 100.00 85.70 5.24 7.24 1.43 0.40
2012 100.00 84.31 5.09 8.34 1.85 0.42
2013 100.00 85.14 3.68 8.83 2.04 0.31
2014 100.00 86.16 2.19 8.93 2.40 0.32
2015 100.00 86.32 2.05 8.94 2.39 0.30
2016 100.00 86.88 1.16 9.12 2.54 0.29
Note : 1.Please refer to Note 1. of “8.Natural Gas Supply and Consumption”.
2.LNG consumption is the consumption of NG(2).
068