
Page 85 - 2016能源統計手冊
P. 85
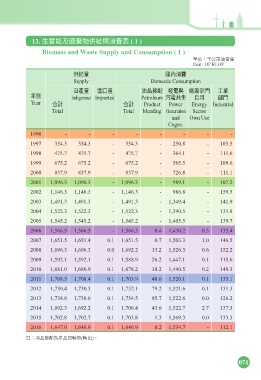
12. ͛ሯঐʿᄻيԶഗၾऊ൬ڌ ( 1 )
Biomass and Waste Supply and Consumption ( 1 )
ఊЗjɷʮ٢ذඎ
Unit : 10 3 KLOE
Զഗඎ ʫऊ൬
Supply Domestic Consumption
Іପඎ ආɹඎ ذۜৣ ೯ཥၾ ঐ๕ژ ʈุ
ϋй Indigenous Imported Petroleum ӛཥ͛ І͜ ژ
Year Υࠇ Υࠇ Product Power Energy Industrial
Total Total blending Generation Sector
and Own Use
Cogen.
1996 - - - - - - - -
1997 354.3 354.3 - 354.3 - 250.8 - 103.5
1998 475.7 475.7 - 475.7 - 364.1 - 111.6
1999 675.2 675.2 - 675.2 - 565.5 - 109.6
2000 837.9 837.9 - 837.9 - 726.8 - 111.1
2001 1,096.3 1,096.3 - 1,096.3 - 989.1 - 107.2
2002 1,146.3 1,146.3 - 1,146.3 - 986.8 - 159.5
2003 1,491.3 1,491.3 - 1,491.3 - 1,349.4 - 141.9
2004 1,522.3 1,522.3 - 1,522.3 - 1,390.5 - 131.8
2005 1,545.2 1,545.2 - 1,545.2 - 1,405.5 - 139.7
2006 1,566.5 1,566.5 - 1,566.3 0.4 1,430.2 0.3 135.4
2007 1,651.5 1,651.4 0.1 1,651.5 0.7 1,503.3 1.0 146.5
2008 1,696.3 1,696.3 0.0 1,692.2 13.2 1,526.3 0.6 152.2
2009 1,592.1 1,592.1 0.1 1,588.9 26.2 1,447.1 0.1 115.6
2010 1,681.0 1,680.9 0.1 1,678.2 38.2 1,490.5 0.2 149.3
2011 1,708.5 1,708.4 0.1 1,703.9 48.6 1,520.1 0.1 135.1
2012 1,730.4 1,730.3 0.1 1,732.1 79.2 1,521.6 0.1 131.3
2013 1,738.8 1,738.6 0.1 1,734.5 85.7 1,522.6 0.0 126.2
2014 1,692.3 1,692.2 0.1 1,706.4 43.6 1,522.7 2.7 137.3
2015 1,702.8 1,702.7 0.1 1,703.8 1.3 1,569.3 0.0 133.3
2016 1,647.0 1,646.9 0.1 1,646.9 0.2 1,534.7 - 112.1
ൗjذۜৣމପۜගᔷ౬(ᔷ̈)f
071