
Page 84 - 2016能源統計手冊
P. 84
ࡈйঐ๕xVARIOUS FORMS OF ENERGY
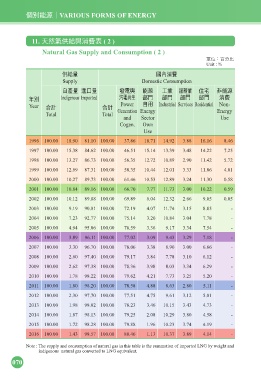
11. ˂್ंԶഗၾऊ൬ڌ ( 2 )
Natural Gas Supply and Consumption ( 2 )
ఊЗjϵʱˢ
Unit : %
Զഗඎ ʫऊ൬
Supply Domestic Consumption
Іପඎ ආɹඎ ೯ཥၾ ঐ๕ ʈุ ਕุ Иσ ڢঐ๕
ϋй Indigenous Imported ӛཥ͛ ژ ژ ژ ژ ऊ൬
Year Υࠇ Υࠇ Power І͜ Industrial Services Residential Non-
Total Total Generation Energy Energy
and Sector Use
Cogen. Own
Use
1996 100.00 18.90 81.10 100.00 37.86 18.71 14.92 3.88 16.16 8.46
1997 100.00 15.38 84.62 100.00 46.51 15.14 13.39 3.48 14.22 7.25
1998 100.00 13.27 86.73 100.00 56.35 12.72 10.89 2.90 11.42 5.72
1999 100.00 12.69 87.31 100.00 58.35 10.44 12.01 3.33 11.86 4.01
2000 100.00 10.27 89.73 100.00 61.46 10.53 12.89 3.24 11.30 0.58
2001 100.00 10.84 89.16 100.00 66.70 7.77 11.73 3.00 10.22 0.59
2002 100.00 10.12 89.88 100.00 69.89 6.04 12.32 2.66 9.05 0.05
2003 100.00 9.19 90.81 100.00 72.19 4.07 11.74 3.15 8.85 -
2004 100.00 7.23 92.77 100.00 75.14 3.20 10.84 3.04 7.78 -
2005 100.00 4.94 95.06 100.00 76.59 3.36 9.17 3.34 7.54 -
2006 100.00 3.89 96.11 100.00 77.02 3.09 9.43 3.29 7.18 -
2007 100.00 3.30 96.70 100.00 78.06 3.38 8.90 3.00 6.66 -
2008 100.00 2.60 97.40 100.00 79.17 3.84 7.78 3.10 6.12 -
2009 100.00 2.62 97.38 100.00 78.36 3.98 8.03 3.34 6.29 -
2010 100.00 1.78 98.22 100.00 79.62 4.21 7.73 3.25 5.20 -
2011 100.00 1.80 98.20 100.00 78.58 4.88 8.63 2.80 5.11 -
2012 100.00 2.30 97.70 100.00 77.51 4.75 9.61 3.12 5.01 -
2013 100.00 1.98 98.02 100.00 78.23 3.46 10.15 3.43 4.73 -
2014 100.00 1.87 98.13 100.00 79.25 2.08 10.29 3.80 4.58 -
2015 100.00 1.72 98.28 100.00 79.88 1.96 10.23 3.74 4.19 -
2016 100.00 1.43 98.57 100.00 80.46 1.13 10.37 3.89 4.14 -
Note : The supply and consumption of natural gas in this table is the summation of imported LNG by weight and
indigenous natural gas converted to LNG equivalent.
070