
Page 40 - 2016能源統計手冊
P. 40
ၝΥঐ๕xCOMPREHENSIVE ENERGY
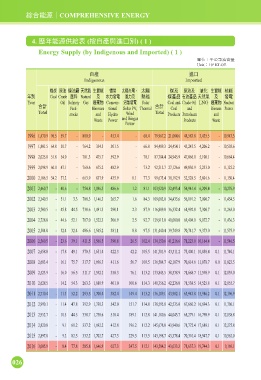
4. ዝϋঐ๕Զഗڌ (ܲІପၾආɹй) ( 1 )
Energy Supply (by Indigenous and Imported) ( 1 )
ఊЗjɷʮ٢ذඎ
Unitj10 3 KLOE
Іପ ආɹ
Indigenous Imported
ލ ࡡذ ذᅀ ˂್ं ͛ሯঐ ࿕੬ ˄ජΈཥe ˄ජ ʿ ࡡذʿ ૰ʷ ͛ሯঐ ࣨঐ
ϋй Coal Crude ආࣘ Natural ʿ ˥ɢ೯ཥ ࠬɢʿ ᆠঐ ପۜ ͩذପۜ ˂್ं ʿ ೯ཥ
Year Oil Refinery Gas ᄻي Conven- ةं೯ཥ Solar Coal and Crude Oil LNG ᄻي Nuclear
Υࠇ Feed- Biomass tional Solar PV, Thermal Υࠇ Coal and Biomass Power
Total stocks and Hydro Wind Total Products Petroleum and
Waste Power and Biogas Products Waste
Power
1996 1,470.9 96.5 59.7 - 800.9 - 453.4 - 60.4 79,967.2 21,004.6 44,583.8 3,435.5 - 10,943.3
1997 1,801.5 64.8 50.7 - 764.2 354.3 501.5 - 66.0 84,409.3 24,454.1 45,245.5 4,206.2 - 10,503.6
1998 2,025.8 51.8 54.0 - 781.3 475.7 592.9 - 70.1 87,784.4 24,945.9 47,066.0 5,108.1 - 10,664.4
1999 2,098.9 60.0 47.1 - 760.6 675.2 482.9 - 73.2 92,515.7 27,126.6 49,030.9 5,233.0 - 11,125.2
2000 2,106.5 54.2 37.2 - 663.9 837.9 435.9 0.1 77.3 99,673.4 30,192.9 52,528.5 5,801.6 - 11,150.4
2001 2,460.7 - 40.6 - 754.8 1,096.3 486.6 1.2 81.1 103,920.9 32,493.4 54,941.4 6,209.4 - 10,276.9
2002 2,340.5 - 51.1 3.3 788.3 1,146.3 265.7 1.6 84.3 109,082.0 34,435.6 56,191.2 7,000.7 - 11,454.5
2003 2,700.5 - 45.8 44.5 738.6 1,491.3 290.1 2.3 87.9 116,889.0 36,332.4 61,992.8 7,300.7 - 11,263.0
2004 2,728.0 - 44.6 52.1 707.0 1,522.3 306.9 2.5 92.7 129,913.0 40,000.0 69,404.0 9,072.7 - 11,436.3
2005 2,584.0 - 32.4 32.4 486.6 1,545.2 381.1 8.8 97.5 131,440.4 39,749.8 70,741.7 9,373.0 - 11,575.9
2006 2,560.5 - 23.6 39.1 411.5 1,566.5 390.8 26.5 102.4 134,150.6 41,216.6 71,223.0 10,164.4 - 11,546.5
2007 2,658.8 - 17.8 49.1 370.5 1,651.4 422.3 42.2 105.5 141,301.9 43,311.2 75,400.1 10,850.4 0.1 11,740.1
2008 2,683.4 - 16.1 75.7 317.7 1,696.3 411.6 56.7 109.5 136,504.7 42,187.9 70,614.6 11,878.7 0.0 11,823.5
2009 2,523.9 - 16.0 56.5 311.7 1,592.1 358.3 76.1 113.2 133,845.5 38,538.9 71,668.7 11,598.9 0.1 12,039.0
2010 2,628.5 - 14.2 54.3 263.3 1,680.9 401.0 100.6 114.3 140,356.2 42,236.0 71,538.5 14,525.8 0.1 12,055.7
2011 2,710.4 - 11.3 52.2 293.5 1,708.4 382.4 149.4 113.2 136,109.1 43,982.1 63,943.8 15,986.2 0.1 12,196.9
2012 2,990.1 - 11.4 47.8 392.9 1,730.3 542.0 151.7 114.0 138,595.8 42,535.0 67,660.2 16,694.3 0.1 11,706.1
2013 2,952.7 - 10.5 44.5 338.7 1,738.6 518.4 189.1 112.8 141,180.6 44,043.7 68,279.1 16,798.9 0.1 12,058.8
2014 2,820.8 - 9.1 61.2 337.2 1,692.2 412.8 196.2 112.2 145,678.0 43,940.6 71,772.4 17,689.1 0.1 12,275.8
2015 2,897.0 - 9.2 82.5 332.2 1,702.7 427.3 229.5 113.5 143,198.7 43,378.4 70,310.4 18,947.7 0.1 10,562.0
2016 3,005.9 - 8.4 77.8 285.8 1,646.9 627.3 247.5 112.1 143,584.2 43,033.3 71,637.3 19,744.3 0.1 9,169.1
026