
Page 47 - 2016能源統計手冊
P. 47
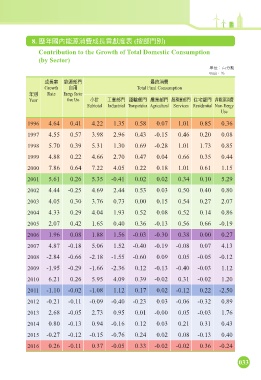
8. ዝϋʫঐ๕ऊ൬ϓڗ্ᘠܓڌ (ܲژй)
Contribution to the Growth of Total Domestic Consumption
(by Sector)
ఊЗjϵʱᓃ
Unitj%
ϓڗଟ ঐ๕ژ ௰ऊ൬
Growth І͜ Total Final Consumption
ϋй Rate Energy Sector
Year Own Use ʃࠇ ʈุژ ༶፩ژ ุ༵ژ ਕุژ Иσژ ڢঐ๕ऊ൬
Subtotal Industrial Transportation Agricultural Services Residential Non-Eergy
Use
1996 4.64 0.41 4.22 1.35 0.58 0.07 1.01 0.85 0.36
1997 4.55 0.57 3.98 2.96 0.43 -0.15 0.46 0.20 0.08
1998 5.70 0.39 5.31 1.30 0.69 -0.28 1.01 1.73 0.85
1999 4.88 0.22 4.66 2.70 0.47 0.04 0.66 0.35 0.44
2000 7.86 0.64 7.22 4.05 0.22 0.18 1.01 0.61 1.15
2001 5.61 0.26 5.35 -0.41 0.02 0.02 0.34 0.10 5.29
2002 4.44 -0.25 4.69 2.44 0.53 0.03 0.50 0.40 0.80
2003 4.05 0.30 3.76 0.73 0.00 0.15 0.54 0.27 2.07
2004 4.33 0.29 4.04 1.93 0.52 0.08 0.52 0.14 0.86
2005 2.07 0.42 1.65 0.40 0.36 -0.13 0.56 0.66 -0.19
2006 1.96 0.08 1.88 1.56 -0.03 -0.30 0.38 0.00 0.27
2007 4.87 -0.18 5.06 1.52 -0.40 -0.19 -0.08 0.07 4.13
2008 -2.84 -0.66 -2.18 -1.55 -0.60 0.09 0.05 -0.05 -0.12
2009 -1.95 -0.29 -1.66 -2.36 0.12 -0.13 -0.40 -0.03 1.12
2010 6.21 0.26 5.95 4.09 0.39 -0.02 0.31 -0.02 1.20
2011 -1.10 -0.02 -1.08 1.12 0.17 0.02 -0.12 0.22 -2.50
2012 -0.21 -0.11 -0.09 -0.40 -0.23 0.03 -0.06 -0.32 0.89
2013 2.68 -0.05 2.73 0.95 0.01 -0.00 0.05 -0.03 1.76
2014 0.80 -0.13 0.94 -0.16 0.12 0.03 0.21 0.31 0.43
2015 -0.27 -0.12 -0.15 -0.76 0.24 0.02 0.08 -0.13 0.40
2016 0.26 -0.11 0.37 -0.05 0.33 -0.02 -0.02 0.36 -0.24
033