
Page 69 - 2016能源統計手冊
P. 69
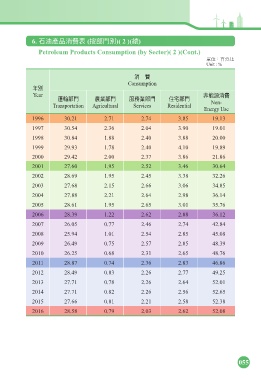
6. ͩذପۜऊ൬ڌ (ܲژй)( 2 )(ᚃ)
Petroleum Products Consumption (by Sector)( 2 )(Cont.)
ఊЗjϵʱˢ
Unit : %
ऊc൬
Consumption
ϋй
Year ڢঐ๕ऊ൬
༶፩ژ ุ༵ژ ਕุژ Иσژ
Transportation Agricultural Services Residential Non-
Energy Use
1996 30.21 2.71 2.74 3.85 19.13
1997 30.54 2.36 2.04 3.90 19.01
1998 30.84 1.88 2.40 3.88 20.00
1999 29.93 1.78 2.40 4.10 19.89
2000 29.42 2.00 2.37 3.86 21.86
2001 27.60 1.95 2.52 3.46 30.64
2002 28.69 1.95 2.45 3.38 32.26
2003 27.68 2.15 2.66 3.06 34.85
2004 27.88 2.21 2.64 2.98 36.14
2005 28.61 1.95 2.65 3.01 35.76
2006 28.39 1.22 2.62 2.88 36.12
2007 26.05 0.77 2.46 2.74 42.84
2008 25.94 1.01 2.54 2.85 45.08
2009 26.49 0.75 2.57 2.85 48.39
2010 26.25 0.68 2.31 2.65 48.76
2011 28.87 0.74 2.36 2.83 46.86
2012 28.49 0.83 2.26 2.77 49.25
2013 27.71 0.78 2.26 2.64 52.01
2014 27.71 0.82 2.26 2.56 52.65
2015 27.66 0.81 2.21 2.58 52.38
2016 28.58 0.79 2.03 2.62 52.08
055